
In recently published article, in Iraqi Economists Network, Shafiq (2013b), a respected oil expert, surveys and analyses histories, policy matters, critical issues, establishes parallels, and then reaches conclusions that reflect his deep knowledge and convictions. I do, by and large, share some of his views especially those relating to the oil & gas law, future levels of oil production, and aspects on enhancing governance of existing oil service contracts (OSCs). Other views/analyses are in need of further discussions. Therefore, without, in any way, diminishing the importance of the messages of the article I will select, below, some of his views/analyses to comment on.
I. Oil resources and reserves
(1-1) The use of such multiple terms as: oil-in-place, potential oil-in-place, resources oil base, potential reserves, ultimate discovered oil reserves, proven ultimate oil reserves, proven reserves, ultimate recoverable reserves, etc. (P.P. 2, 5, 9) could well create confusion. For the uninitiated these terms, if not clearly defined apriori, are incomprehensible. The one-line bracketed explanation, on page 3, of oil-in-place and proven reserves, however, is insufficient, in the light of subsequent use of those multiple terms. For instance, logically, ‘potential’ is a subset of ‘ultimate potential’, therefore, some readers might wonder how could ‘proven ultimate oil reserves” be 128 Billion barrels while ‘potential proven reserves’, 455 Billion (page 5).
(1-2) Moreover, and notwithstanding the difficulty and uncertainty in defining oil-in-place or oil-resources-base, the narrative sometime leaves the reader in doubt about the figures. On page 5 it is stated that “potential proven reserves were estimated at 455 B[illion] barrels,[Bb]“. Then the author refers to table 2 in the same page where we read that oil-in-place is 468 Bb. Furthermore, on page 9, table 3 contains a resource-base for Iraq of 410 Bb. These figures are close enough to suggest that the author, in this instance, considers the three terms to be, more or less, equivalent. An explanatory note would have been helpful.
(1-3) The 410-455-468 Bb range is close to the Ministry of Oil (MoO)’s figure of 500 Bb, but very different from IEA’s ‘ultimately recoverable resources’ of 232 Bb; both of which are reported in IEA (2012). It is also different form ‘total present Iraqi oil resource base’ of 331 Bb, previously reported by the author in Shafiq (2011). To contribute a clarification and better understanding, one would have expected the author to contemplate a comparison of available estimates and a choice of what he considers the most likely one. Also the figure of 45 Bb for oil-in-place in Kurdistan, KRG, reported in IEA (2012), also merits a comment. See also Mehaidi (2013).
(1-4) A summary list/appendix of definitions for the different ‘technical terms’ concerning oil resources, reserves, etc, would have been beneficial. I find an internationally recognized publication titled ‘Petroleum Resources Management System’ (see references, below), and in particular, a diagram titled ‘Resources Classification Framework’, on page 2, very useful. I have included the outline of oil resources classification in Iraq according to this diagram in Merza (2013). The diagram, including updated tentative numbers for Iraq (as of end-2012) commensurate with MoO’s figures for oil-in-place and proved reserves, is reproduced below.
To see the diagram please refer to the PDF version
It is worth noting that in April, 2013, the Ministry of Oil raised the estimation of proved reserves from 143 billion (shown on the diagram) to 150 billion barrels. As petroleum-initially-in-place, PIIP, is given (at specific date or period), therefore, the increase in proved reserves is to be deducted from other components of PIIP; e.g. probable or possible reserves. In this case, the upper limits to contingent resources and non-proved reserves, in the diagram, fall from 105 to 98 billion barrels. Also note that in principle, each year’s production is to be deducted from proved reserves of that year. This principle, however, is hardly reflected in annually published figures, for proved reserves, for most countries. See, for instance, OPEC’s Annual Statistical Bulletins.
II. Development cost and average cost of production
(2-1) The article correctly divides oil production costs into: finding, development, and operating costs. However, the presentation, especially of the development cost, in the article, fails to establish a relationship with average cost of production. Let us quote “On the whole the Finding Cost should remain in the region of a fraction of $1 per barrel and the Development cost around $7,500-$11,000 per bpd of built production capacity, which is equivalent to $1.5-$2.0 per one discovered barrel. The associated operating cost should be in the region of $1.5-$2.0’, P. 8.
(2-2) The mapping of {$7,500-$11,000 per bpd} into {$1.5-$2.0 per one discovered barrel} does not seem a mapping into a development cost per produced-barrel, which is necessary to relate it to average cost of production. A clearer widely used standard economic mapping is available, instead, which I will consider instantly. Let us first note that development cost per capacity-barrel ($7,500-$11,000, in the article) is a stock variable; it represents the cost of building a capacity to produce one barrel a day over the lifetime of the production process. To calculate the development cost per produced-barrel, the standard economic mapping is from the said stock variable to a flow variable called ‘depreciation’ cost. To do that one needs to divide the stock variable by number of days over the lifetime of the production process.
(2-3) Calculation of depreciation cost per produced-barrel: let us assume production to take place over 365 days per year and a lifetime of 20 years. Accordingly, the depreciation cost is calculated as follows:
($7,500-$11,000)/365/20 = $1.02-1.51 per produced-barrel.
With shorter producing days per year the depreciation cost rises monotonically, while with longer lifetime it drops monotonically.
(2-4) Average cost of production: to calculate average cost per produced-barrel at the wellhead we add depreciation cost to operating cost per produced-barrel (noting that, according to the article, the finding cost is negligible). Thus, at 365-day year and 20-year lifetime, average cost is calculated as follows:
Average cost = Depreciation cost ($1.02+$1.51) + Operating cost ($1.5-$2.0) = $2.52-$3.51 per produced-barrel.
Compared to other parts of the world, it is clear that average cost of oil production in Iraq is very low.
III. Future production and contracted plateaus in oil service contracts
(3-1) The author warns against future annual production of 10-13 mbd (including KRG), favouring instead a production path according to IEA (2012)’s central scenario. Let us quote, ‘In conclusion: Planned Capacity of 13+ mbpd [mbd] is beyond Iraq and IOCs to achieve by 2017 and the global market demand. Unless rescheduled in line with IEA Study of 2012, …, of 6mbpd by 2020 and 8mbpd by 2035, overcapacity will result in heavy financial penalties payable to the IOCs. One can only hope that the present negotiation of the MoO with the IOCs contractors would bring the total capacity down to avert much of the likely difficulties’. Furthermore, he reiterates IEA’s justifications for lower production profile; mainly, ‘[lack of]… rapid, co-ordinated progress in main areas to ensure the timely availability of rigs, sufficient water for injection to maintain reservoir pressure and adequate storage, transportation and export capacity’. The author also stipulates that ‘Iraq will also require more professionalism and less political interference’, P. 12.
(3-2) Granting this, I would add other equally important reasons, to support the case for lower oil production profile; mainly, requirements of long-term sustainability of public expenditures, the needs of the economy, and considerations pertaining to absorptive capacity of the economy, Merza (2011).
(3-3) However, the case for lower production could face two factors/hurdles. First, current ‘official’ production targets are higher than IEA’s central scenario. This is contained in the recently released Integrated National Energy Strategy (INES)’s Medium and High scenarios (MEES, 2013). The second is the dilemma that could arise from contracted plateaus in existing oil service contracts (OSCs). I alluded to this dilemma, in Merza (2009); mainly, the contractor would either push for higher production or insist on fee compensations commensurate with contracted plateau rather than actual production; when the latter is below the former. The outcome could either reduce Iraq’s financial gains or constrain its decision on oil production in relation to international oil market/OPEC. That is why the author hopes for lower plateaus to emerge from current negotiations concerning existing OSCs. However, looking at preferred INES’s production paths, on the one hand, and official statements, on the other, it seems that plateaus, although to be lowered, would not go down to levels commensurate with IEA-based production profile.
IV. Contractor’s remuneration
On the basis of background calculations, the author indicates that $2/barrel fee, in existing OSCs, implies 30% rate of return for the foreign contactor, P. 24. This, he contends, is mainly due to the fact/assumption that ‘investment outlays’, by the contractor, are repaid as they occur rather than extended over long period of time as in Concessions and production-sharing agreements, PSAs. This rate of return, however, is of doubtful relevance to the evaluation of existing OSCs. This is due to the fact that, in principle, the $2/barrel fee is not related to the said ‘investment outlays’, which are, to the contractor, more like short-term loans than long-term investments. Compare this with an exactly similar contract but the contractor does not contribute to investment outlays, in which case, the definition of his rate of return becomes problematic. Much more relevant, to the evaluation, is the comparison of total Iraqi-side income received from an existing OSC with that from possible alternative arrangement, Merza (2009). It is, incidentally, worth noting that $2/barrel is a gross fee, which falls with increasing production [actually with associated step-wise increase in R-Factor; Merza (2011)]. The foreign contractor gets about 49% of the gross fee. The rest goes to income tax (35%) and national counterpart (16%).
V. Libyan production-sharing agreements
A statement on page 20 runs as follows: ‘Libya has managed the grant of as low as 7% in their PSAs a few years ago’. This statement needs to be corrected and qualified. In general, Libya’s PSAs are considered very beneficial to the Libyan side (see Merza, 2012, Chapter 10). By 2007, Libya’s PSAs (called Exploration and Production Sharing Agreements, EPSAs) were under the so-called EPSA-3. In EPSA-3 an international oil company, ICO, is granted a share in production. In return, besides sharing costs, it pays, inter alia, 60-65% income tax and 16.7% royalty on production. As indicated in the table below, in 2007, ICOs’ shares in production ranged from 25% for Repsol to 49% for Veba, Marathon, Oasis group, and Wintershell.
In 2008 Libya started to promote new arrangement (devised in 2004); called EPSA-4, applicable to new and operating PSAs. Under EPSA-4, and depending on its share in EPSA-3, an operating ICO to be given production share of 10%-18%, while a new ICO to be given 10%-12%. In return, and this is key, it is absolved from paying the 60%-65% income tax and 16.7% royalty. Of course, ICOs continue to pay their share in costs. By 2010, new and some operating ICOs agreed to apply the new arrangement. Therefore, in 2010, as shown in the table below, the shares of ICOs ranged from 12% for Respol, OXY/MOV, and Veba, to 15% for ENI Oil, to 49%-50% for Wintershell and TOTAL.
To see the table please refer to the PDF version
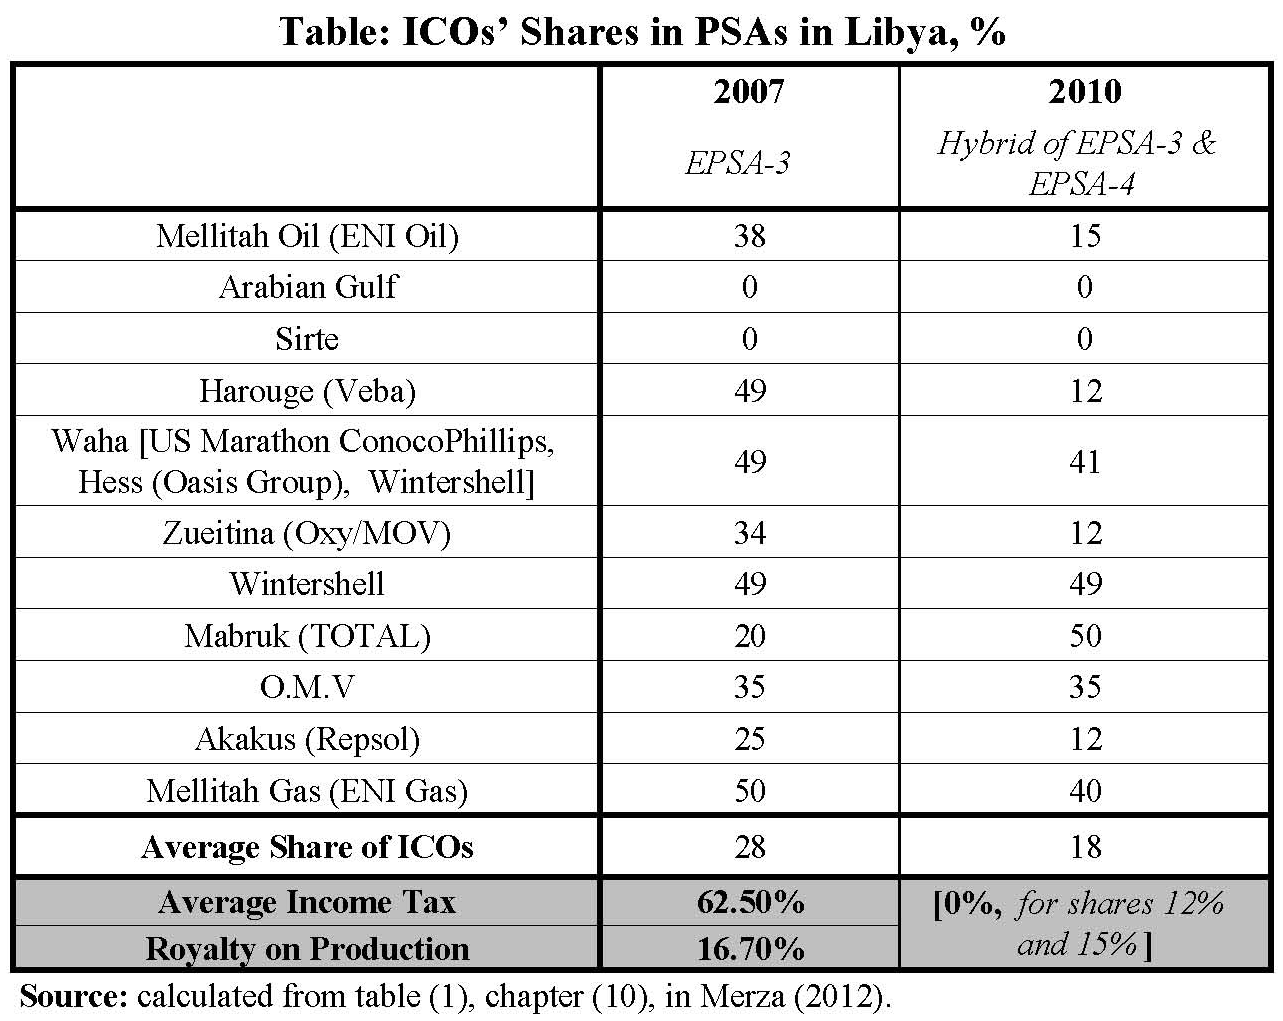
In conclusion, the reduction of some ICOs’ shares (to 12%-15%, not 7% as mentioned in Shafiq’s article) is accompanied with zero income tax and zero royalty. Furthermore, I have shown in my book on Libya (Merza, 2012, chapter 10 and its mathematical appendix) that, at 2010 oil prices, on average, government revenues hardly change when applying the pre-2008 EPSA-3 or post-2008 EPSA-4.
References
International Energy Agency, IEA (2012) Iraq Energy Outlook, World Energy Outlook, Special Report, October.
MEES (2013) ‘Document – Iraq’s Integrated National Energy Strategy [INES]’, 17 June.
Mehaidi, K. (2013) ‘Oil Reserves in Kurdistan’, Iraqi Economists Network, IEN, 28 April, www.iraqieconomists.net.
Merza, A. (2009) ‘First Round Of Licensing In Iraq: An Economic Evaluation’, MEES, 24 August.
_____ (2011) ‘Oil revenues, public expenditures and saving/stabilization fund in Iraq’, International Journal of Contemporary Iraqi Studies 5: 1, pp. 47–80, doi: 10.1386/ijcis.5.1.47_1.
_____ (2012) Libya: Lost Opportunities and Renewed Hopes, Arab Institute for Studies and Publishing, Beirut, (in Arabic).
_____ (2013) Iraq: Current Condition and Future Economic Prospects, a paper presented at IEN’s First Conference, Beirut, March 30-April 1, 2013, (in Arabic).
Shafiq, T. (2011) ‘A veteran revisits Iraq’s oil resource and lists implications of the magnitude’, Oil & Gas Journal, June 6.
_____ (2013a) ‘Iraq’s Petroleum Law: Problematic Issues & its Fate’, a paper presented at IEN’s First Conference, Beirut, March 30-April 1, 2013.
_____ (2013b) ‘Iraq’s Oil Historical Perspective: Why? When? How?’, IEN, October 31, 2013.
Society of Petroleum Engineers, SPE, American Association of Petroleum Geologists, AAPG, World Petroleum Council, WPC, Society of Petroleum Evaluation Engineers, SPEE (2007) Petroleum Resources Management System.
* Dr. Merza had worked for the Iraqi Ministries of Oil and Planning and for the United Nations Department of Economic and Social Affairs in the Middle East and North Africa. merza.ali@gmail.com.
@ Iraqi Economists Network (IEN).
Republication is permitted on the condition that a reference is made to IEN.


Comment here