Download PDF file
A funny thing happened on the way to the euro. When it was first introduced to the global financial markets in 1999, the Euro began to appreciate in value compared to the U.S. dollar (USD). Around this time, West Texas Intermediate crude oil was trading below $20 a barrel. As the dollar lost value, oil began to rise. Is this a coincidence?
The dollar began to devalue against the euro and other major global currencies in 2003, primarily as a result of the Iraq War costs. By year-end 2002, the dollar had weakened by nearly 20 percent and the price of crude had jumped more than 30 percent. Things got no better for the beleaguered dollar from then on. By December 2004, it was trading at $1.35 to the euro and crude oil had risen to over $43 per barrel. This depreciation continued through the mid-2000’s and as it did, our account balance widened and oil prices climbed with the euro. With the subprime mortgage crises of 2007 and 2008 as a backdrop, the malaise continued, culminating in early July of 2008 when crude reached its historic apogee of more than $146 per barrel. In that same fateful week, the euro hit its apogee of $1.604.
As further proof, the correlation coefficient (which measures the strength of the linear relationship between two variables) between the West Texas Intermediate crude price and the value of the U.S. dollar to the euro, was greater than 0.87 between October 2001 and July 2008, and even higher than 0.90 in several periods before and after the collapse of July 2008.
Drivers of Oil Price
The basic laws of supply and demand are simply stated as:
1. If demand increases and supply remains unchanged, a shortage occurs, leading to a higher equilibrium price.
2. If demand decreases and supply remains unchanged, a surplus occurs, leading to a lower equilibrium price.
3. If demand remains unchanged and supply increases, a surplus occurs, leading to a lower equilibrium price.
4. If demand remains unchanged and supply decreases, a shortage occurs, leading to a higher equilibrium price.
The major factors that drive oil prices are (1) the global economy, primarily the U.S., the European Union and China; (2) energy scarcity, including reserve accretion and depletion; and (3) purchasing power, expressed in the respective currencies of those countries, with the heaviest influence from the U.S. dollar.
Because a large majority of global oil is traded in U.S. dollars, the volatility of that currency has tremendous influence on the real price of oil. Any weakness in the value of the USD against other currencies increases the purchasing power of countries that are not USD denominated.
For example, if the value of the dollar is even with the euro, then, all things being equal (crude qualities, transportation, and supply/demand), the cost of a barrel of crude oil would be the same for parties transacting in dollars or euros. However, if the dollar strengthened, then it would require more euros to purchase a barrel of oil. The reverse situation is not only true, but has been exhibited for the past several years; whereby countries denominated in the euro pay less for a barrel of oil in dollars.
So a weakened USD is a key driver of higher oil prices. It doesn’t diminish the role of supply and demand, but it is of equal importance. The question then becomes what is the dollar’s outlook and what corresponding effect would it have on oil prices, and therefore revenue and profit for oil companies? Let’s look at two scenarios.
Low Price Cases
In June 2013, the World Bank said that “… over the longer term, oil prices are projected to fall.” Your case for lower prices would argue that the EU economy is worse than thought and that the U.S. economy strengthens more than forecasted. Also in June 2013, the European Central Bank had a dour assessment, once more revising downward their GDP outlook. According to The Economist, “The protracted weakness especially in southern Europe is inflicting social misery.” [They] went so far as to proclaim that “… the most corrosive of all is loss of hope as the lost decade continues”.
As well, you believe that United States shale oil is a game-changer and production volumes will continue to grow as a rash of new wells are drilled and infrastructure is built. U.S. oil production grew by more than one million barrels per day in the last year to 7.5 million barrels per day, the largest increase of any country in the world and the highest U.S. output in more than 22 years. This is mostly due to new production from the Bakken, Eagle Ford and other new shale targets, as well as soaring activity in the Permian Basin and several other producing regions.
OPEC (particularly Saudi Arabia) has demonstrated the ability to quickly replace production lost by other members. A recent International Energy Agency outlook says that OPEC’s spare output capacity (total production capacity less anticipated demand) will grow to nearly 7.2 million barrels per day by 2015, up from 5.7 million barrels in 2013. History shows that OPEC is prone to fragmentation and its members ignore production quotas when they need money, further adding supply and lowering the price of crude.
High Price Cases
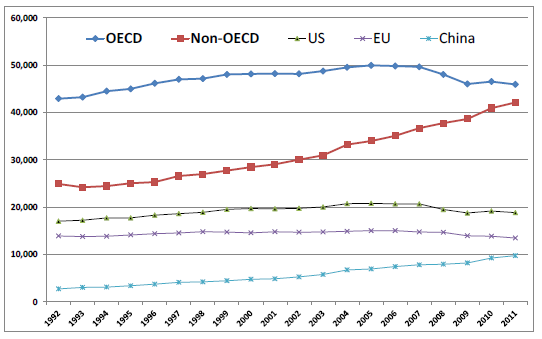
Barring a geopolitical event triggering wild crude oil speculation, if you make the case for higher oil prices, you would believe that the global oil supplies are finite and are depleting at alarming rates. The world population continues to grow exponentially, and energy demand is at an all-time high. This year, for the first time, non-Organization for Economic Co-operation and Development (OECD) countries will use more oil than OECD countries. China, SE Asia, India, Mexico, Indonesia and other non-OECD countries have enormous populations and energy consumption is growing at a pace much faster than that of OECD member nations.
According to the Energy Information Administration (EIA), the average American used around 312 MM Btu’s in 2011, down around 5 percent from the prior six-year average, but still nearly twice that of the average German, Frenchman or Japanese. The average Chinese citizen used an average of only 82 MM BTUs; but this was a 23 percent increase over the prior six-year average. This is staggering when you consider that the population of China is estimated at nearly 1.4 billion. If their demand for fuels continues to grow at recent rates, China’s oil demand will grow 25 percent more by 2018.
It’s highly unlikely that the U.S. will ever completely stop being a net importer of oil. Results from the upstart shale oil plays are less spectacular than the adolescent Bakken and Eagle Ford plays were, but the wells are just as expensive. The U.S. Geological Survey estimates approximately 3- to 4.3 billion barrels of recoverable oil from the Bakken and Eagle Ford shales. The high-side case amounts to less than eight months of oil consumption for the U.S.
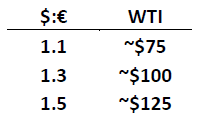
In mid-October 2013, the price of oil dipped under $100 for the first time in 16 weeks. The biggest short-term driver to maintain oil prices above $90 would be if the U.S. economy remains lackluster and the EU economy begins healing. In that scenario, the dollar remains weak and the USD:Euro could fall back to 1.45 to 1.50 range, which could bring oil back to the $120 to $140 area.
The dollar to euro scenarios might look like this:
If the U.S. dollar strengthens against the euro by 10 to 15 percent during the next 18 to 24 months, oil prices could fall back to the $80 to $90 range. If the EU economy continues to appear to stabilize, we’re looking at $90 to $110 oil for at least a couple of more years. The investment advisory firm Alliance Bernstein predicts that WTI will average over $100 in 2014, and longer term prices above $120 and rising to over $160 by the end of the decade. Others predict lower prices, based on factors such as China’s economic cooling, fast ramp-up of U.S. shale plays and the opening up of Mexican oil concessions to foreign companies. While these arguments all have legs, barring a geopolitical crisis, it’s likely that the U.S. economy will slowly continue to strengthen, the EU will continue to guise its economic maladies, and oil prices will maintain somewhere in the $90- to $100 range for the next 18 to 24 months.
If that holds true, domestic oil production will continue to roll and investment will pour into the sector at an unprecedented rate in 2014 and 2015. What this means to producers is that they have to continue their emphasis on raising the technology bar to increase efficiencies and lowering costs in finding and developing oil. As well, when forecasting oil prices for capital budgeting or acquisition purposes companies should also monitor the value of the U.S. dollar.
*) Jim Harden is a Principal and the Valuation Services Leader at Hein & Associates, a full-service accounting and advisory firm


Comment here